

In a previous post, I set up the status quo for our two class,  household society, motivated by the most recent Household Budget Survey data, to formalise my thinking spelled out in this post. The last post was coming to a point where we could feel comfortable talking about aggregate household welfare (as measured by their disposable income) in the context of a simple tax and transfer government.
The way we modeled the status quo was to say each household  had a certain amount of taxation revenue,
  , which went to the government, removed from it, and then had a direct transfer of some revenue from the government,
  , added to their wealth in the form of educational services, so the `budget profile' in any period for any household,
  , can be given by the expression
 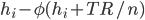 . The social welfare function of this list of households and their wealth is now given by


 .
.
Now let's change the status quo. Let's make the substitution of a one-fits all free education transfer to a sliding scale income contingent loan facility for those households in the list which the government deems wealthy enough to support their own educational financing.
Begin with the following observation: some households in this list have more income than other households. Now the government as policy-setter can choose a filter which, for every household, assigns it to one group or another, rich  , or poor,
  . Those who are poor perceive no change in the status quo, because they continue to be fully funded by the government in a direct transfer as before.
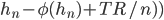
Those households whom the government deems rich continue to pay their taxes as before, but this time they only recieve part of the educational transfer from the government, in a sliding scale going down as the income of each individual household $i$ goes up as we move up the list. The rest of the educational fees they must pay our of their disposable income net of taxes.
Now each household which belongs to the `rich' group, , has a `budget profile' like this:
 ,
,
where  denotes the fees set by the university (of which more in a later post), and
  is a sliding scale parameter dependent on the household's position in the income list within the `rich' group.
The social welfare function for this group is


I'll provide a numerical example in the next post.
Now we need to show that this social welfare function,  .
.
Proof
Proof strategy. It is sufficient to show  `Lorenz' dominates
  , which implies we need to show . The way to prove this is to sum the elements of the list and compute an inequality index like Gini. If as measured by gini, then using the properties of the Atkinson index, the social welfare function will dominate another.
Due to a deadline on a paper, I'll have to do this in part three tomorrow.
Related articles
