
Right, time to get all economic theory on this issue, which I've written about before in a less formal way,
Imagine a list of everyone in the country (organised by household), indexed by their incomes. This list looks like the following:  , with
  being the richest household in the list and
  being the poorest. We can draw a distribution around this list by taking a density measure, which is like drawing a histogram. The reason we want to do this is to see where the distribution peaks. Does it peak in the middle, in which case the average is a good measure of overall wealth, or does it peak somewhere else, in which case we'll have to work out some other way of properly describing this list.
Mathematically, we go looking for the probability mass function (not the probability density function) of this list, because it is discrete. The probability mass function, pmf, gives the probability that a discrete variable (in our case, the household income list) is exactly equal to some value, or in our case  for all
  , which just says that
  has a distribution given by
  . We compute this pmf, and it can tell us, for the list of household incomes we have, whether the average household income is a good way to measure income inequality within the households on this list. One other nice thing the pmf can back out for us is the gini coefficient of a suitably transformed Lorenz curve.
So, using the pmf, we can compute a discrete version of the gini coefficient. The Gini coefficient measures the relationship between cumulative shares of the population according to the level of disposable income, and the cumulative share of total disposable income recieved by them. In Ireland, we find the ratio of the very highest incomes to the very lowest is something like 14 to 1, according to Nolan and Smeeding, (2004 version) page 16, so we should expect the gini to be substantially skewed. The discrete gini for our households is given in this case by
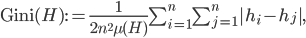 where
where  , the mean of the distribution.
Or, when you compute it using the figures given in the latest household survey, you get a number like 31.7, which is Ireland's Gini for 2005 to 2005, as calculated by the household budget survey. Total equality would produce a gini measure of 0, and total inequality would produce a gini of 100. A gini of 31.7 for Ireland in 2005 means we are less equal than some countries, like the USA, but less equal than others, like Denmark.
So, is the mean income a good measure of how much the country should be spending on education? Because the distribution is highly skewed, as we can see from the figure below (link to spreadsheet), which maps income shares to decile year to year, the answer is no. A movement to the right from the straight lines I show for each curve would indicate an increase in overall inequality.
The chart below plots disposable income by decile from 1999-2000 and 2004-2005, the last data we have, from the household budget survey. One can see the blue line (for 1999-2000) spiking up less sharply on the right hand side of the graph than the red line (for 2004-2005), implying there is a bigger jump between the 9th and 10th deciles than before. And if the gini for Ireland in 2004/2005 is 31.7, it is 32.4, barely less than its much later measurement.
Now let's talk about social welfare functions.
Social Welfare Functions
A social welfare function, swf, is a real valued function  , which is defined for a particular distribution, in our case . We can display it as
We'll be using the social welfare function in a minute to compare two policies. The most important property of the social welfare function is direct comparability. For two distributions, say  and
and  , the social welfare functions of each can be ranked, so if we have
  , then the first distribution produces higher levels of social welfare and is so-called Pareto dominant. This function is dependent on several restrictive assumptions, of which more here. Once we accept we can rank (on some criterion) two different income distributions, then we can proceed.
A two class society
Say there are now two clases in Irish society (there can be any number actually, but it makes things much simpler to write it out like this) and a government. We can partition the group of n people in our society into 2 groups such that any individual will fall into just one of these 2 groups. We can then compute inequality within the sub groups as if they were the only group in the function.
Our social welfare function will look like this:

Now is, formally, an aggregation function and the terms following the semicolons represent each groups' dependency on the groups' share of the population,  , or the group's income,
 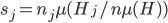 .
.
We can now define Atkinson, Theil, and generalised entropy class-type indices for our household distribution in a discrete and formally correct fashion, which we will do in a later post. We can also talk about embedding our inequality indices within growth models, of which more later as well.
Now let's talk about a simple proposition for our two class, one government household.
Say the households are taxed proportionally at some level  , where the total taxation take in a period, period 1, can be given by
 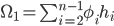 for households
  .
.
This total tax take must fund the government's purchases in a single period, so the government must spend  on goods and services
  , investment
  , saving,
  and transfers,
  .
.
Say the only transfers which make up are funds for the university system.
The government wishes to increase funding for the universities, to some level, without increasing .
It is going to do this by changing the status quo, which I'll describe now.
Status Quo
The government pays for every household, giving them an automatic entitlement through their membership in the list, to the pot of money represented by , so the social welfare function for the status quo will look like this:

for all households  .
.
That's part one. Tomorrow, I'll set up the new policy in terms of social welfare functions, derive a new optimality condition for the government, and discuss appropriate measures of redistribution if the new policy gets enacted, as well as defending the current system, flawed though it is.
References (so far)
Cowell, F. A.; Flachaire, E. 'Income distribution and inequality measurement: the problem of extreme values.' Journal of econometrics 141, no. 2 (2007), pp. 1044-1072.
Nolan, Brian and Smeeding, Timothy M., Ireland's Income Distribution in Comparative Perspective. Review of Income Wealth, Vol. 51, No. 4, pp. 537-560, December 2005
Related articles
- Jared Bernstein: Poverty, Income, and Health Insurance: What to Expect and Why It Really Matters
- How the super-rich are changing our lives
- $200,000 a Year Makes You Rich
- UK income gap widens
